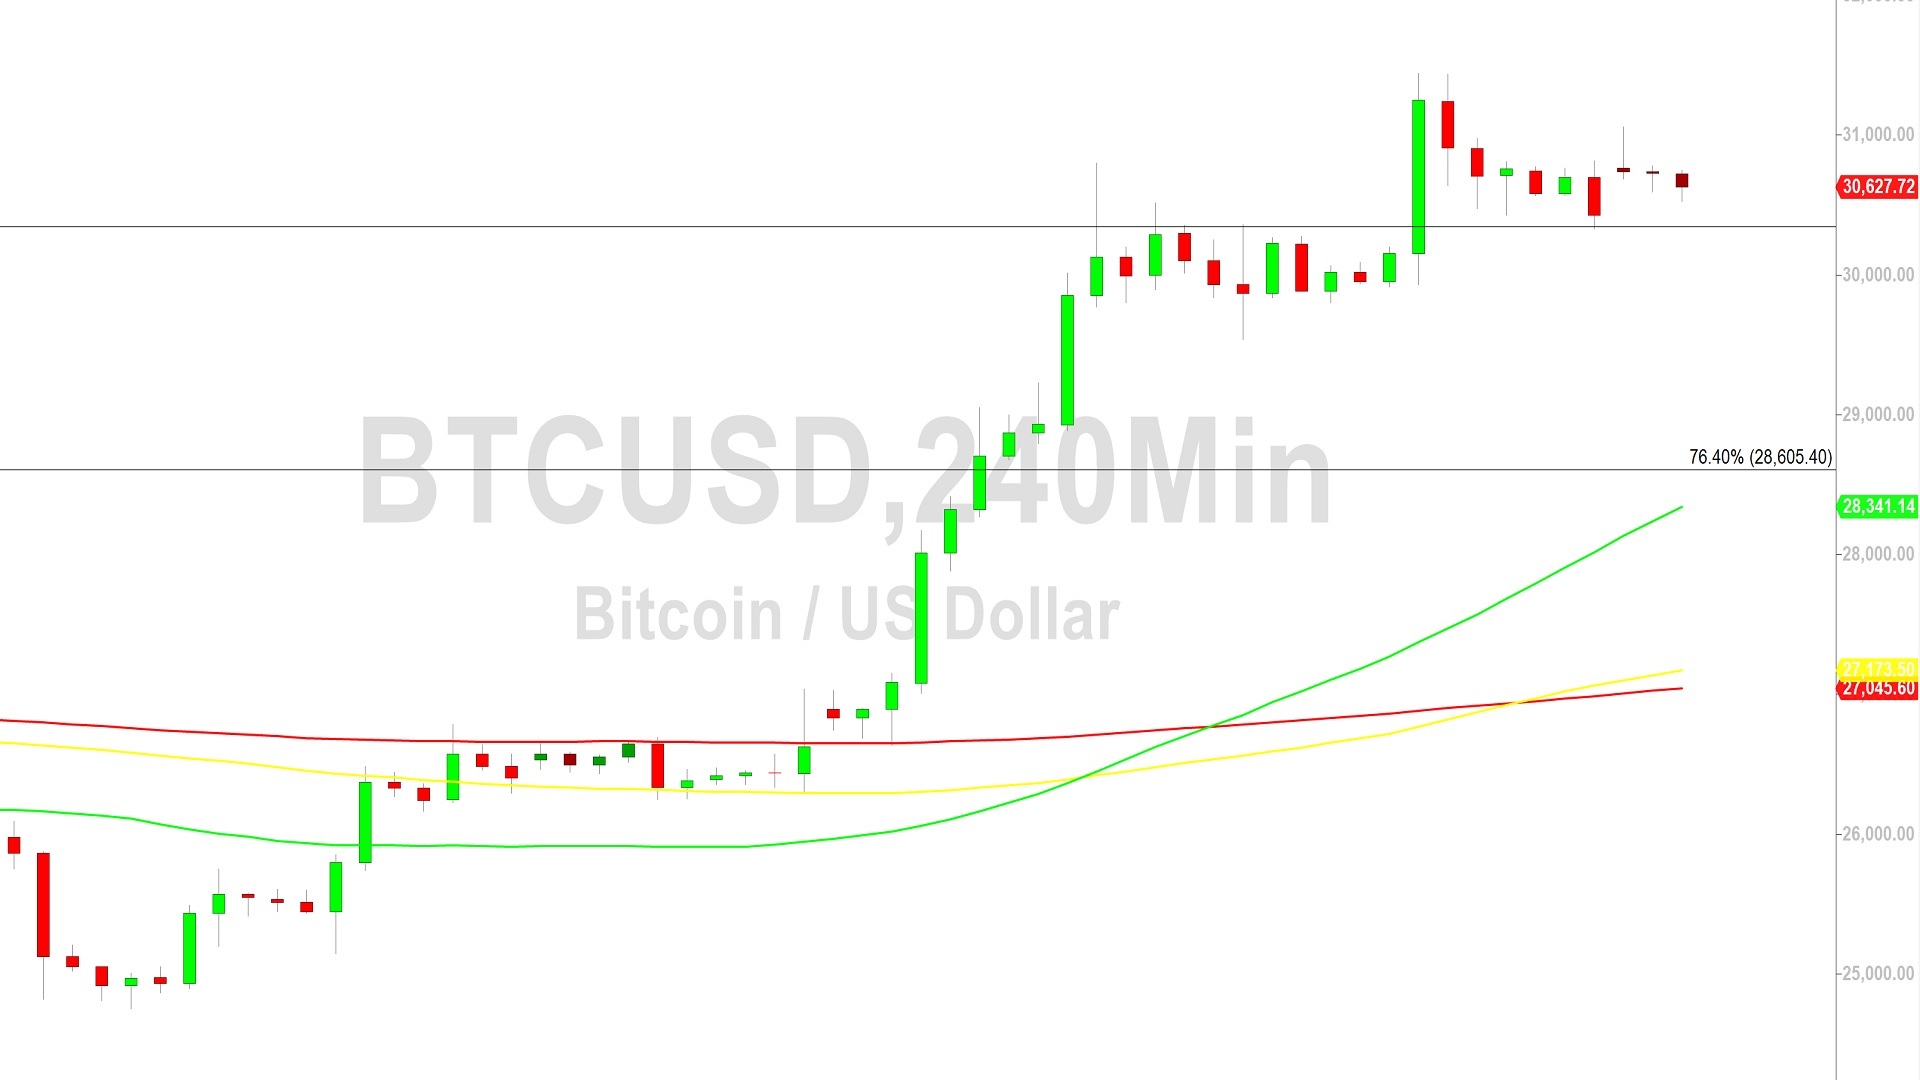
BTC/USD Guided by Short-Term Technicals: Sally Ho’s Technical Analysis – 26 June 2023 Bitcoin (BTC/USD) added to ongoing range expansion early in the Asian session as the pair was softer after peaking around the 31057.86 area, a move that represented a test of the 61.8% retracement of the recent depreciating range from 31443.67 to 30330.61. Prior to the move higher, buying pressure emerged around the 30330.61 area, right around the 61.8% retracement of the recent appreciating range from 29539.57 to 31443.67. BTC/USD continues to orbit the 38.2% retracement of this range while awaiting technical guidance. The recent rapid appreciation to the 31443.67 area was its strongest level in twelve months and represented a test of the 31488.23 area, an upside price objective associated with buying pressure that strengthened around the 26637.41 area. Stops were also recently elected above the 30127.80 area during the ongoing appreciation, an upside price objective associated with historical buying pressure that emerged around the 15460 and 19568.52 areas. Stops were also triggered above additional upside price objectives around the 29068, 29159, 29458, 30088, 30200, 30292, and 30477 levels. Additional upside price objectives include the 31737, 32125, and 33569 areas. Stops are cited above additional upside price objectives around the 31674, 32043, 34531, and 34658 areas. Following recent upside price activity, areas of technical support and potential buying pressure include the 30192, 29863, 29423, 28886, 28179, 28096, and 27293 areas. Technicians are closely watching to see how much technical support develops around the 28095.44 area, representing the 23.6% retracement of the historical depreciating range from 69000 to 15460. Traders are observing that the 50-bar MA (4-hourly) is bullishly indicating above the 100-bar MA (4-hourly) and above the 200-bar MA (4-hourly). Also, the 50-bar MA (hourly) is bullishly indicating above the 100-bar MA (hourly) and above the 200-bar MA (hourly). Price activity is nearest the 50-bar MA (4-hourly) at 28341.03 and the 50-bar MA (Hourly) at 30549.31. Technical Support is expected around 24440.41/ 23270.10/ 22769.39 with Stops expected below. Technical Resistance is expected around 31986.16/ 32989.19/ 34658.69 with Stops expected above. On 4-Hourly chart, SlowK is Bullishly above SlowD while MACD is Bearishly below MACDAverage. On 60-minute chart, SlowK is Bearishly below SlowD while MACD is Bearishly below MACDAverage. Disclaimer: Sally Ho’s Technical Analysis is provided by a third party, and for informational purposes only. It does not reflect the views of Crypto Daily, nor is it intended to be used as legal, tax, investment, or financial advice. For Further Information Click on Below ButtonShow More